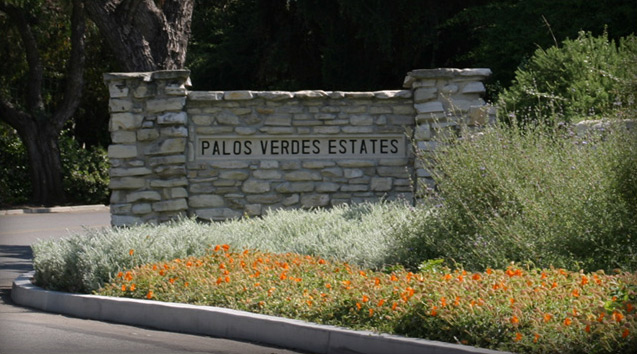
2017 started off great. 13 homes sold in the first quarter within 97% of the asking price. But, as in the past, sellers are starting to feel confident and as a result we are seeing “optimistic” pricing. I don’t blame sellers. I, like many realtors, am an optimist (you sort of have to be in order to survive in this career). We tell our clients “prices are rising,” or “there’s no inventory!” and the “buyers are hungry.” In fact, I took most of these statements from blog posts and articles I’ve written over the past 12 months. Some of it is definitely true. Prices are at record highs in Valmonte and elsewhere – see the chart below.
Buy buyers aren’t dumb, nor irrational. You can make the argument that as prices climb, buyers become more discretionary. When you look at homes over the 6 or 12 month median, buyers have more choices and more things to consider. Take a look at the inventory/supply chart below. It’s based on month’s supply of inventory and compared to last year, inventory is definitely rising. Turnover in Valmonte is the lowest of all the neighborhoods in PV, and the normal scarcity of homes helps push the prices up. Why the recent increase in inventory? The increase is more likely due to a seasonal increase and won’t likely be sustained. Several of the homes on the market are the result of divorce, job relocations, and retirements, as opposed to people moving out of the area because they don’t like it.
There’s some good news in the tea leaves. Price strength is supported from the bottom up. So far to date, the lowest priced home sold was $1,070,000 (3700 PV Dr North). There have been more homes sold over $2m than ever before. But the question everyone is asking, “can it keep going up?” In the chart below, the median sales price (weighted over 12 months) has plateaued in Valmonte while it has continued to rise in all of Palos Verdes Estates. Going beyond the numbers alone, the increase in PVE v Valmonte could be due to the larger homes and new construction in the areas of the city outside of Valmonte like Montemalaga and Lunada Bay. Those areas boast average lot sizes of 14,000′ allowing much larger homes to be built. In fact, in 2017, the average home sale in Montemalaga is $2.7m. However, on a price/foot basis, Valmonte actually exceeds the median price/foot for the entire city.
Median Price/Foot (12 month rolling average – click to select a specific month)
The litmus test: The fundamentals remain – buyers still want to move to nice neighborhoods like Valmonte, and sellers are reluctant to sell until they have to. This creates a supply and demand imbalance that continues to favor the seller, and it doesn’t seem to be changing too quickly.
For more about the real estate market, I encourage you to listen to the Chief Economist at the California Association of Realtors in her recent Q&A at the Teles Properties Headquarters in Beverly Hills. She had some great insights to the current market, what the future looks like, and how the market has changed in the recent cycle.


No Comments