Browsing Tag

Palos Verdes Estates Real Estate

Real Estate Market, Valmonte Homes

2018: Valmonte Real Estate Forecast – Are we in a bubble? What about taxes? And Should I Buy or Sell in 2018?

June 5, 2018
valmonte-20161

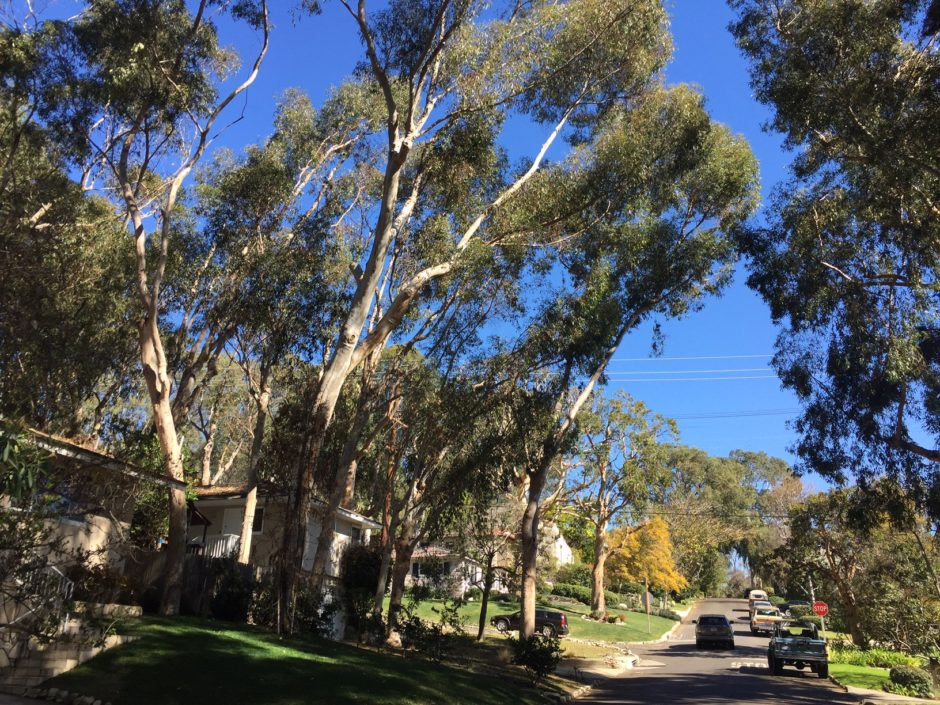
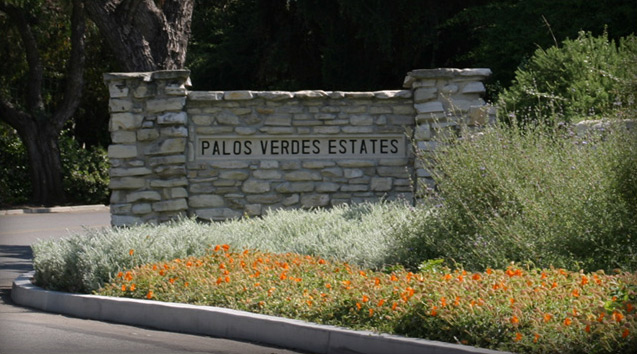
Spring greetings from our humble abode here in Valmonte.  After a bumpy start in the stock market, I write with the prospects of a great year ahead in both the overall economy, as well as the local real estate market.  The Valmonte real estate market is coming off a strong end to 2017, and a robust start to 2018.  In fact, in the last 24 months, no home in Valmonte has sold for less than $1,000,000! In the last year, homes sold for 98.3% of the asking price, and 1/3 sold over asking!  Across the board we saw the days on market drop, and supply remained around 2 months or lower, especially for homes under $2,000,000. Bottom line: it’s still a seller’s market.


Are we in a Bubble?

The short answer is NO!  Prices have risen for 5 straight years, but even in Valmonte, the price per square foot is only 1.4% more than previous highs set in 2007.  But this market is different; here’s why….

  1. Relative Affordability – Despite the seemingly high prices, housing affordability is 2 to 3 times higher today than during the last market peak in 2006/07.  Adjusted for inflation, the average sales price in Valmonte is still nearly $100k less than the last market peak.
  2. Buyers have skin in the game – The last market peak was supported by no-money down and stated income loans.  Not this time; lenders typically require buyers to have 20% down payments.
  3. Low unemployment – Job growth is outpacing new housing starts, and even without new jobs, there is still a lack of supply to meet the demand for housing.  
  4. Interest rates are still historically low – In fact, interest rates are 2 to 3 points lower in this market cycle than they were in 2006 and 2007.  Keep in mind that buyers are buying a payment more than they are a house.
  5. Renting is expensive – Expensive rents are one of the primary drivers motivating first time homebuyers.  Even with the reduction in deductible home ownership expenses in the new tax plan, first time buyers are motivated to buy a home.

What can we expect for 2018?

After a wild run to start the year in the stock market, followed by some crazy volatility, here are our predictions for the coming year.

  1. Interest Rates – Interest rates will continue to rise, but gradually.  This is sort of a no-brainer, as it’s been predicted for the last several years.  But higher rates are pushing hesitant buyers to get off the fence.
  2. Tax Reform – The effects of the newly passed tax reform won’t stifle home buying and selling as some have warned, but it will likely exert downward pressure on supply.  Limited supply will make it more challenging for move-up buyers until baby boomers are ready to cash in on their equity.
  3. Price growth – Consumer confidence is at the highest level in over 17 years, and the consensus from economists is that home prices will increase moderately at around 4% in 2018.  We expect higher growth at the entry level homes in the neighborhood while the top end will remain relatively flat – so far in 2018 this is the case.
  4. Support from the Bottom Up – The growth that led us out of the  market bottom started on the high end with wealthier neighborhoods seeing massive price growth in 2013 and 2014.  While those markets level off, the lower priced neighborhoods will continue to push the market up.
  5. Buy Investment Property – The new tax laws won’t hurt landlords; and in fact, it will likely help them.  If rising rates and lower inventory reduces the number of first time buyers, landlords will continue to be able to raise rents.  Even with a limited supply of multifamily properties and lower overall returns, owning investment property still remains a solid hedge on inflation and is a great way to diversity your portfolio.

If you are wondering how the changing economy affects you and your real estate, give me a call, I’m happy to help!

See you in the neighborhood, Kyle

Real Estate Market

Mid-Summer Musings on Valmonte Real Estate

July 26, 2017
image1

Market climate – Valmonte

  • There are currently 16 homes on the market, approximately double the amount year-over-year, and near the highest level in the current market cycle
  • The absorption rate is 4.7 months, and nearing the peak of 6.4 months supply in October 2014  
  • Prices on a square foot basis are near record highs ($734/ft)
  • Days on Market for the last quarter are at record lows (41 days)
  • On an annual basis, median sales prices have leveled off in Valmonte ($1.5m)  
  • Homes in Valmonte are selling generally within 1% of the list price

Lot’s of inventory, price drops on the way?

After 5 years of appreciation, the market is showing signs of leveling as the market transitions from a seller’s market to a buyer’s market.  The increasing supply is indicative of a “me too” selling climate where sellers are trying to take advantage of higher prices while the good times are around.  If the inventory levels hold, I expect prices to decline slightly into the Fall and Winter months when buyer activity tends to dip.  On the buyer front, interest rates remain stable around 4%, but the consensus is that rates will rise slightly over the next 6-18 months.

How does Valmonte compare to the rest of PVE?

Valmonte is a micro market compared to the larger Palos Verdes Estates market and for the most part, the trends lines parallel one another across the board.  The exception is prices on a per foot basis tend to be higher in Valmonte  than that of the entire city, due mostly to the smaller homes and generally tighter supply.


Uncategorized

Realistic Pricing? At Least for a Couple Months Anyway

July 6, 2017
PVE sign along Via Valmonte Drive

2017 started off great.  13 homes sold in the first quarter within 97% of the asking price.  But, as in the past, sellers are starting to feel confident and as a result we are seeing “optimistic” pricing.  I don’t blame sellers.  I, like many realtors, am an optimist (you sort of have to be in order to survive in this career).  We tell our clients “prices are rising,” or  “there’s no inventory!” and the “buyers are hungry.”  In fact, I took most of these statements from blog posts and articles I’ve written over the past 12 months.  Some of it is definitely true.  Prices are at record highs in Valmonte and elsewhere – see the chart below.

Buy buyers aren’t dumb, nor irrational.  You can make the argument that as prices climb, buyers become more discretionary.  When you look at homes over the 6 or 12 month median, buyers have more choices and more things to consider.  Take a look at the inventory/supply chart below.  It’s based on month’s supply of inventory and compared to last year, inventory is definitely rising.  Turnover in Valmonte is the lowest of all the neighborhoods in PV, and the normal scarcity of homes helps push the prices up.  Why the recent increase in inventory? The increase is more likely due to a seasonal increase and won’t likely be sustained.  Several of the homes on the market are the result of divorce, job relocations, and retirements, as opposed to people moving out of the area because they don’t like it.

There’s some good news in the tea leaves.  Price strength is supported from the bottom up.  So far to date, the lowest priced home sold was $1,070,000  (3700 PV Dr North). There have been more homes sold over $2m than ever before.  But the question everyone is asking, “can it keep going up?”  In the chart below, the median sales price (weighted over 12 months) has plateaued in Valmonte while it has continued to rise in all of Palos Verdes Estates.  Going beyond the numbers alone, the increase in PVE v Valmonte could be due to the larger homes and new construction in the areas of the city outside of Valmonte like Montemalaga and Lunada Bay.  Those areas boast average lot sizes of 14,000′ allowing much larger homes to be built.  In fact, in 2017, the average home sale in Montemalaga is $2.7m.  However, on a price/foot basis, Valmonte actually exceeds the median price/foot for the entire city.

Median Price/Foot (12 month rolling average – click to select a specific month)

The litmus test: The fundamentals remain – buyers still want to move to nice neighborhoods like Valmonte, and sellers are reluctant to sell until they have to.  This creates a supply and demand imbalance that continues to favor the seller, and it doesn’t seem to be changing too quickly.

For more about the real estate market, I encourage you to listen to the Chief Economist at the California Association of Realtors in her recent Q&A at the Teles Properties Headquarters in Beverly Hills.  She had some great insights to the current market, what the future looks like, and how the market has changed in the recent cycle.

Real Estate Market, Valmonte Homes

Valmonte Late Summer Market Update: Did We Just See the Peak?

August 23, 2016
4209 Via Pinzon - High Res-004

4209 Via Pinzon, $1,450,000 (listed by Kyle Daniels, Ericson Beach Real Estate) www.liveinvalmonte.com

As we enjoy the remaining warm days and quiet evenings of another wonderful summer in Valmonte, it’s time to take inventory of the local real estate market and get an idea of where things are headed.  To put things in perspective, we have enjoyed over 43% in average sales price appreciation over the last 4 years.  These rising home prices have largely been driven by limited inventory and low interest rates, which further aided buyer demand.  But as this current growth cycle matures, the $100,000 question is how long can the market continue to rise?  To answer that question, I like to turn to three indicators that give us some historical perspective of what’s statistically going on with the market – month’s supply, list price to sales price ratio, and days on market.

History lesson: Market Cycles

In 2005 and early 2006, our last market peak, homes were selling on average 98% of the asking price in approximately 22 days.  In fact, in the market run up from 2002 through early 2006, homes were selling in an average of 19 days over that time period.  In addition, home prices appreciated 56% and inventory was much like it is today – tight supply with less than 2 month’s worth of inventory.  We can look to less stringent lending standards during that time period as one reason for the shorter days on the market, but clearly demand outpaced supply and sellers were willing and able to take advantage of that imbalance.  Of course, we all know what ensued -the market flattened out for a couple years before dropping nearly 30% over four years, before before seeing a recovery in mid-2012.

[googleapps domain=”docs” dir=”spreadsheets/d/14kf4J3e9ATXWyuEXFCZVw2KSO2FLG4ror-P-vlqxfJA/pubchart” query=”oid=1249737409&format=interactive” width=”600″ height=”371″ /]

But here we are today, sitting comfortably in our newly appreciated homes and feeling pretty smart about our 43% price appreciation over the last four years.  During this growth cycle, homes sold on average in 64 days – three times the amount of time it took in the last bull market.  Months supply is roughly the same as the 2002-06 cycle with around 2 months of inventory available.  

How long will it last?

If you arelike most folks, the memories of the last market crash are hard to shake, and you’re thinking, “how much longer can prices continue to rise?”  Looking at 21 years of sales data from the MLS as our guide, we’ve seen three growth cycles since 1995, each lasting about 4-5 years, followed by 2-3 years of flat growth, then 2-3 years of declining values before the next growth cycle kicks in.  Getting deeper into the weeds, when we look at price/foot comparisons over the same time frame, prices grew over a 10 year cycle before declining for 6 years.  This tells us that the base price tends to expand and contract over a shorter time frame while price/foot changes over longer cycles.  What this means is that if you are a buyer during a down cycle, you are likely getting more home for your dollar while seeing a stronger appreciation if you can make some improvements leading into the next growth cycle.  Just as in stocks, buy low and sell high, right?

Nota bene!

It is important to note, over the last 20 years, the growth cycles have been stronger and lasted longer than the contractions.  And in most cases, price gains have outpaced declines by a factor of 2 to 1.  But if we really step back and look at the net results, if you held a property in Valmonte since 1995, you have enjoyed an average price increase of 192% and a price per foot increase of 178%.  Not too bad for living in a beautiful neighborhood with excellent weather, friendly neighbors, and great schools.

So to answer my own question, if you were to ask me to bet money on how much longer prices will rise, I will be inclined to tell you we are coming to an end of the growth cycle, and that more than likely, we’ll see a leveling out for the next couple of years before we see any downward momentum in home values.  What could change my prediction?  Without a mortgage debt crisis looming like we saw in 2008, the headwinds for price growth today are the potential for rising interest rates and the inability of recent college graduates to pay off student loans to free up more capital to purchase their first home.  When that next reality hits is anyone’s guess, but for now I’m going to enjoy the nice weather and finish a few projects around the house before cooler weather and the holidays come back around.

See you in the neighborhood!

Real Estate Market, Valmonte Homes

Prices are up, Inventory is down, but the Summer Selling Season Gives Buyers Hope

May 24, 2016
IMG_5950

Let’s face it, if you are a buyer looking to move to Palos Verdes Estates, and you don’t have over $2 million, it’s a tough market out there.  The same goes for buyers in Manhattan Beach, Hermosa Beach, and increasingly Redondo Beach.  As for the beach cities, there are at least several lower priced options including condos and town homes that will get you location, views, and that coveted beach zip code many buyers are looking for (may I recommend 446 Palos Verdes Blvd) But if you don’t want to hear your neighbor’s toilet flush or their phone ring, buyers looking to “the Hill” are facing steep competition at the lower entry points to each neighborhood.

Taken as a whole, inventory is down compared to a year ago throughout the South Bay and Palos Verdes.  On the other hand prices are up over 4% in the general area and over 10% in the most popular neighborhoods.  If you are shopping at the entry point to any neighborhood, the competition is stiff, especially under $1.5m. However, there is an interesting trend recently reported by CoreLogic that we are seeing – rising inventory and fewer sales in the higher price ranges.  To illustrate this, look at Manhattan Beach where list prices are averaging $4.3m.  Compared to a year ago, available inventory (and months supply) has nearly doubled from 61 homes to 115 homes.  On the other hand, the number of closed sales remains steady around 31/month.  In Valmonte, where sold homes averaged $1.67m (3 month rolling average), inventory is down over 40% from a year ago and closed sales are up on a monthly basis.  Hmmnnn, are we starting to see signs of a bubble on the high end?

FullSizeRender (2)

Enter a caption

2517 Via la Selva in Valmonte – ask $1,999,000, SOLD $2,067,000

Fortunately there is some hope on the horizon for those eager buyers as summer approaches.  In the past Valmonte has averaged around 12-13 available homes during the summer months . This summer bump is true for the beach cities as well.  But as prices climb, the buyer pool tends to shrink and homes sit on the market longer.  As a result, prices drop, typically as we head into the holidays and unsold inventory sits.  Is this what we have in store for our market?  Only time will tell, but for now, my buyers are still looking for that perfect Valmonte home for their family and there isn’t much available for them.

IMG_5950

101 Via Colusa – ask $1,250,000; SOLD $1,352,500!

If you are thinking of buying or selling a home, please contact Kyle Daniels, Ericson Beach Real Estate, 310.483.3998 or kyle@kyledanielsrealestate.com for a confidential consultation.

Neighborhood News

PV Little League, the Tradition Continues

February 29, 2016

Since 1954

When we first moved to Valmonte, one of the first things our neighbors told us not to miss was baseball season, especially the burgers.  Having grown up not too far down the road in Hermosa Beach, I thought to myself “sure, Little League was fun, but what’s the big deal?”  At the time my son was only 1, so it seemed like a distant event.  Well, Spring came around that year, and it didn’t take long on that first Saturday for the smell of the burgers on the grill to drift down from the field and into our yard.  So our Saturdays at the swingset with our little one soon became Saturdays with burgers at the swingset.  My little guy enjoyed watching the big boys on the main Valmonte field play ball, and we had a good excuse to be a part of the community.  Fast forward 4 years and our little guy is in his first season of T-Ball, and we are in the thick of it.  Now I too will get to be the one flipping burgers on the grill, cheering on our aspiring sluggers on the diamond, and officially becoming a Little League Dad.

IMG_0505

The Phillies on a 100 year old fire engine

Opening Day Parade

This weekend we celebrated Opening Day and the 62nd PV Little League season with the traditional parade from Malaga Cove field to Valmonte Field.  It was incredible to see the teams out decorating their team floats and trucks – a true bonding event for everyone.  Even more impressive was the huge support from neighbors and local families who lined PV Drive North to cheer the teams on. Between the tasty burgers at the field and the traditions like the parade, whether you’re a Little League parent or fan, baseball season in Valmonte is a neighborhood tradition to cherish.  Play Ball!

Valmonte Homes

3rd Quarter Valmonte Real Estate Market Report: Spoiler Alert: Prices Are Reaching New Highs!

October 16, 2015

Is it really fall?  It’s hard to believe amidst 85 degree weather that we’re getting ready for the days to slow down, stocking up on candy for the trick-or-treaters, and thinking about the coming holidays.  But like the weather, the real estate values in Valmonte are headed towards all-time highs.  The average sales price through September 30th is a record $1.546m – up over 14% from 2014.  On top of that, there have already been 45 sales through September 30th this year, compared to 34 homes sold in all of 2014.  Historically speaking, on a price/foot basic, prices have rallied 28% from market lows set in 2012 ($509/foot); however, the average price/foot is off 11% from market highs set in 2005 ($729/foot) and 2006 ($728/foot).

3025 PV Dr North

Ericson Beach Real Estate Listing – 3025 Palos Verdes Drive North

How long does it take for a house to sell?  Average days on market (DOM) for sold homes is trending downward to 42 days for listings sold in the last three months.  This is down from an average of 102 DOM in January.  This decrease in DOM can be attributed to seasonal averages.  However, compared to 2014, the DOM has actually increased.  The longer days on market can be attributed to higher overall prices for the area as well as more available inventory.  Closing prices compared to asking price have returned to 98% of asking, an indicator that on average, houses are being marketed at fair prices.  Year over year this number has improved from 94%.

What’s ahead? Locally, demand remains steady, and as high prices in the South Bay beach cities continue to price out buyers, Palos Verdes Estates and surrounding areas can expect to see continued buyer interest.  What are the potential challenges? Price growth in the short term may face headwinds with rising mortgage interest rates and a limited number of qualified buyers as prices continue to climb while wages and job growth wane.  The result – we’ll likely see a leveling off in prices until more qualified buyers enter the market.

Valmonte Market Statistics

# of Homes Price Range Ave $/foot Average price
Active listings 10 $1.338m – $2.295m $770/foot $1,714,200
In Escrow 3 $1.475m – $1.699m $620/foot $1,574,333
Sold 45 $799k – $2.625m $656/foot $1,546,067
2014 Sales 34 $865k-$2.299m $656/foot $1,354,569
Uncategorized

2014 Valmonte Home Prices Rise 3% and Where We’re Heading in 2015

February 24, 2015
Sold sign

February 24, 2015, Palos Verdes Estates, CA

Valmonte 2014 Real Estate in Review  

After a gangbusters 2013 where we saw a 21% year-over-year increase in values (based on price/foot), the Valmonte real estate market cooled off a bit in 2014.  Values continued to rise, but at a more modest, and much more sustainable 3.14% year-over-year increase.  While the price increases slowed, the average Days on Market (DOM), an important measure of how long it takes a house to sell, dropped from 67 days in 2013 to 52 days in 2014 (this was the lowest average DOM since 2007).  Looking at another key figure, the asking vs selling price comparison remained tight with houses selling at 97.74% of the asking price in 2014 compared to 98.26% in 2013.  Compare this to 2009 when houses were selling at 93.52% of the asking price – a tough market for sellers.  Finally, another sign of strong seller’s market is the fact that 11 of the 34 houses sold in 2014 sold at or above the asking price – another improvement from 2009 when not one house sold over asking.  This continues suggests that there is fierce competition for well priced, move-in ready homes and sellers have their choice of buyers.

According to the S&P/Case-Shiller CA-Los Angeles Home Price Index, prices were up 5.1% year-over-year in the Los Angeles area in 2014.  This suggests that our local Valmonte market is relatively on par with the general market in the greater Los Angeles area, albeit at a higher priced entry point to move in.  This higher entry price could explain the slightly lower YOY appreciation.

Figure 1a. 3 year Valmonte SFR sales statistics

Year # Houses Sold Average Price Average Price/Foot Year/Year % change Ave. Days on Market
2012 41 $1,213,049 $509.05 -2.73% 132
2013 33 $1,513,765 $616.62 21.13% 67
2014 34 $1,354,569 $635.98 3.14% 52


2015 Is Off to a Slower Start

Since the new year, 6 homes have closed at a price per square foot of $607.91 with selling prices between $799k and $2.05m.  The average days on market is 101 days – a considerable uptick from last year’s 52 days (one of these homes was a short sale which skew the numbers to the higher side).  In addition to closed sales, there are 7 homes in back-up and 2 listed as pending.  The majority of these homes were listed in the latter part of 2014, during which home sales are traditionally slower than the peak spring and summer months.

Active Listings

There are currently 7 Valmonte homes for sale as of today priced between $1.475m for a 1742 square foot traditional home on Via Nivel to 3,500 square foot traditional home on a corner lot on PV Drive North in the Eucalyptus grove priced just under $2.2m.  The average list price/foot is $685/foot – a nice bump from last year’s $635/foot – but time will tell if these homes sell close to that price.  Three of these listings have been on the market for 120 days or more, a good indication that they will likely need a considerable price reduction before buyers are ready to move in.  In fact, their respective prices confirm this – all are priced considerably more than the average price per square foot of the other listings.

What’s on the horizon as we head into the traditionally busy selling season?  If you are a seller, you’re in luck.  Demand for Valmonte remains strong with many young families looking to enjoy the peaceful tree lined streets and top rated Palos Verdes Schools.  In addition, financing continues to be favorable to buyers with low rates and banks willing to lend.  If you are a buyer, I would qualify ASAP for a solid loan with a good mortgage banker and be ready to write a strong offer when your dream house is on the market.  And, of course, whether you are a buyer or a seller, I would suggest you call me to help you reach your real estate goals while the market is hot!

For a custom price analysis of your home or for tips on buying or selling a home, please feel free to email directly at kyle@kyledanielsrealestate.com.  You can also visit my website at www.kyledanielsrealestate.com.

Thanks for reading!

Valmonte Homes

Valmonte Remains a HOT Market

April 2, 2014

G06-086_F_Palos-Verdes-photoThings aren’t showing any signs of slowing down here in the Valmonte real estate market. In just the last few weeks we’ve seen most new listings go into escrow with multiple offers.  The sweet spot seems to be move-in ready homes under $1.6 million. Houses in need of significant repairs or updates seem to be lingering around longer until there is a notable price drop. In the last week we saw 3908 Via Picaposte show up with a for sale sign in front and it was quickly in escrow at a price indicated as “over asking” by listing agent Ginni Lee of RE/MAX. Meanwhile, 4109 Via Picaposte was under contract again after a $100k price drop. Considering it closed in January 2013 at $1,060k, a new price of $1.299m isn’t a bad return for a hold and flip. Lastly a nicely upgraded family home, 4304 Via Nivel, had multiple offers and is reportedly on its way to closing over asking.  So far, our micro market is on pace with the general market in Southern California, albeit at a higher priced entry point to move in.

2014 So Far   Since the new year, 5 homes have closed at prices between $1.296m and $2.15m at a price per square foot of $547.  2 of those sold homes have closed over the asking suggesting that competition for homes in Valmonte is tough.  Currently there are 6 homes available in Valmonte priced from $1.13m on the low end to $2.48m on the high end going into the selling season.  What’s on the horizon?  While time will certainly tell, for now, if you are a buyer, I would find a solid rate with a good mortgage banker and be ready to write a strong offer when your dream house is on the market.  If you are considering selling?  Well, of course, I would suggest you call me to get your home sold while the market is hot!

For more tips on buying or selling a home, please go to my website at www.kyledanielsrealestate.com or feel free to email directly at surfrealtor@gmail.com.

Uncategorized

Irrational Exuberance?

February 13, 2013

Image

If you followed Alan Greenspan during his tenure as chairman of the Federal Reserve then you are probably quite familiar with the term “Irrational Exuberance.”  This term often used by the chairman refers to a “heightened state of speculative ferver” as explained by economist Robert Shiller (widely known from the Case/Shiller home price index).  While the numbers are too few at this point to confirm this irrational exuberance in the current Valmonte market, there are signs that certainly point in this direction.  With only two listings currently on the market and many buyers combing the MLS for new listings, there is clearly evidence of demand far outpacing the supply.  If the party-like atmosphere at this weekend’s open house on Via Solano is any indicator, then we certainly are on our way to a speculative ferver.  How long this will last is anyone’s guess.  Human nature tells us that when something is hard to get, we tend to want it more.  And when we feel that something is scarce, we tend to act more irrationally than when there is a feeling that time is on our side and we have multiple options to chose from.  My advice, take a deep breath before you go plunging off the cliff and make hasty decisions.  Patience is typically rewarded.  While it may not seem like it today, there will be other homes for sale.  This will be especially true if prices continue to rise – as there are emotions stoked by scarcity, there are emotions provoked by the opportunity to make money.  Good luck.