Browsing Tag

Valmonte

Real Estate Market, Valmonte Homes

New Listings are Up, Pending Sales are Down – What does that mean for you?

June 5, 2018
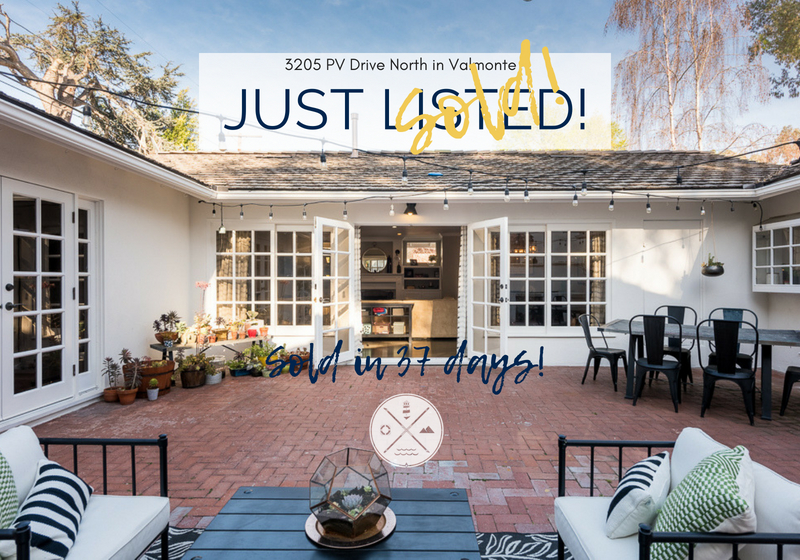
Just Sold! 3205 PV Drive North.

It’s June and the beginning of the “summer selling season” for real estate in Valmonte.  Instead of a bunch of flowery talk about how great everything is about the market, I’m going to go out on a limb and dare to be more realistic than perpetually optimistic.  The local real estate market is setting up for a price correction.  The bigger question, and one I don’t have an immediate answer to, is for how long?  

Let me explain.  Annualized average sales prices in Valmonte have risen steadily since January of 2015 and are up nearly 50% since March 2010.  In that same period, inventory has declined to our current supply levels of approximately 2.5 months supply of homes. (The chart on the following page illustrates this over the last 10 years).  At the same time, the sales price compared to original list price is hovering around 99-100% of list, but that’s where the change is about to happen.  As the message of tight inventory has been spread around in newsletters like this and other media outlets, sellers have increasingly overpriced their homes.  I don’t need to name specific homes, but any recent look at the MLS or Zillow, and you will see what I mean. In the meantime, mortgage rates have risen significantly over the past year and maybe headed to the 5% range for a 30 year mortgage – the highest level in 7 years.  Finally, add into the mix a slate of new homes lined up to hit the market in Valmonte, and we are setting the table for what may quickly shift from a sellers market to a buyers market.  If not a full blown buyers market, then I do think, at the very least, there will be good buying opportunities in late summer and early fall.

This exact scenario has taken place on several occasions over the last 4 years.  After inventory spikes in the summers of 2014, 2016, and 2017, buyers were able to buy homes on average less than 95% of the asking price as the result of a short term supply glut.  In all these cases, the market returned to a seller’s market shortly after, but the short term price correction provided excellent buying opportunities for those in the market for a new home.  Challenges to this model would be a sudden drop in interest rates, or a bevy of new buyers coming to the market, but both are unlikely given the recent economic growth and already inflated house prices.  

What I am suggesting is that, like the stock market recently experienced, it would not be unusual for a short term price correction in local housing prices.  I don’t expect all neighborhoods to be affected the same. In areas like Redondo Beach and Torrance, prices are still relatively affordable compared to other beach cities, and inventory is still trending below 2 months supply in these markets.  But in higher priced areas like Palos Verdes Estates, Hermosa Beach, and Manhattan Beach, prices are already showing signs of weakening.

In the long run, we’ll still see general price growth for the next two years, as long as there aren’t major shocks to the overall economy.  Limited supply is still an issue in most areas throughout Southern California, and until significant building takes place or job growth drastically slows, the market will remain out of balance. To give you further peace of mind, economists at Fannie Mae predict a 4-6% price appreciation in 2018 and 2019, with 30 year mortgage rates hovering in the upper 4% range.

So for now, if you are a seller, you need to be very realistic with your pricing if you hope to sell your home in a reasonable amount of time.  If you are a buyer, I don’t know that sitting back and waiting for a crash is a good idea, but instead, be ready to pounce on some good deals when they come around.

Click here if you would like to download a copy of my most recent I Love Valmonte newsletter or email me to receive a complimentary copy sent to your inbox.

See you in the neighborhood, Kyle
Neighborhood News, Real Estate Market, Valmonte Homes

Valmonte Halloween Fun and November 2017 Market Update

November 7, 2017
img_3257

Once again, Halloween in Valmonte did not disappoint! The Halloween tradition is one of the unique things that makes living in Valmonte lots of fun, and it was great to see all the families and kids getting into the spirit again this year. Our kids had a great time, and I know we went through over 500 pieces of candy at our home alone (and I know we were not alone)!

img_3226

As for real estate, we are entering one of the traditionally slower times of the year. After a sales boost in August, October followed the September cooling trend in Valmonte. Inventory, measured as month’s supply, increased from 3.4 months supply in September to 4.3 months in October. Active listings for the month also reached a 3 year high with 17 homes available during the month. However, supply levels indicate the market still favors the seller as a balanced market is considered 6 months of supply. The increasing supply means that despite the high prices, we are reaching a more balanced market.

As for prices, Valmonte homes are just shy of record highs seen over the last 12 months. However, in the last few weeks with demand waning, prices of homes that have been on the market over 60 days are experiencing reductions. Prices in Valmonte continue to be a driver of activity. Homes priced under $1.5m continue to see the strongest activity and fewest days on the market. As you cross the $2m threshold, the time on the market increases. Of course there are exceptions in both price categories as unique homes or overpriced homes buck the trends. As has been the been case over the last 5 years, activity and prices typically drop as well head into the Holiday season. With 13 homes for sale in the neighborhood, buyers may find that this is the time to find their Valmonte home at a discount to the peak selling season seen in the Spring and early Summer months.

One question that remains to be answered is how long will prices hold both on a local level and throughout the region? We turn once again to interest rates with the belief that any significant rise could result in slowing sales and as a result, dropping prices. Of course, we have wondered for last several years when this interest rate hike will take place. Also, as of last Thursday, factor in the proposed tax plan which could limit mortgage interest and property tax deductions, and prices may cool off slightly. In the meantime, the overall economy keeps showing signs of strength with the unemployment rate at 10 year lows and corporate earnings holding steady. Throughout Southern California, demand still outpaces supply, and even with lower potential real estate tax deductions, and a slight increase in interest rates, it’s a safe bet we’re not heading for a real estate slump anytime soon.

Real Estate Market

Mid-Summer Musings on Valmonte Real Estate

July 26, 2017
image1

Market climate – Valmonte

  • There are currently 16 homes on the market, approximately double the amount year-over-year, and near the highest level in the current market cycle
  • The absorption rate is 4.7 months, and nearing the peak of 6.4 months supply in October 2014  
  • Prices on a square foot basis are near record highs ($734/ft)
  • Days on Market for the last quarter are at record lows (41 days)
  • On an annual basis, median sales prices have leveled off in Valmonte ($1.5m)  
  • Homes in Valmonte are selling generally within 1% of the list price

Lot’s of inventory, price drops on the way?

After 5 years of appreciation, the market is showing signs of leveling as the market transitions from a seller’s market to a buyer’s market.  The increasing supply is indicative of a “me too” selling climate where sellers are trying to take advantage of higher prices while the good times are around.  If the inventory levels hold, I expect prices to decline slightly into the Fall and Winter months when buyer activity tends to dip.  On the buyer front, interest rates remain stable around 4%, but the consensus is that rates will rise slightly over the next 6-18 months.

How does Valmonte compare to the rest of PVE?

Valmonte is a micro market compared to the larger Palos Verdes Estates market and for the most part, the trends lines parallel one another across the board.  The exception is prices on a per foot basis tend to be higher in Valmonte  than that of the entire city, due mostly to the smaller homes and generally tighter supply.


Real Estate Market, Valmonte Homes

Inventory Is Up, Price Growth Is Stalling, but Demand Remains

July 7, 2017
kd-2016-area-images38

The 2017 second quarter numbers are in, and yes, life is still great in Valmonte.  For many of you reading this, I assume you currently live in Valmonte, and like I hear from many neighbors, you plan on leaving feet first or “in a pine box” as one neighbor so eloquently put it.  So what I’m about to tell you about house prices probably doesn’t really matter that much.  For the rest of you that are thinking of selling a home or looking to buy one in Valmonte, you may want to keep reading.

For the last 5 years, the median home price in Valmonte has climbed from a low of $950,000 to a high of $1,500,000 ( based on a 12 month weighted average to account for seasonality and anomalies). During that time inventory has hovered around 2 1/2 months supply, with a few exceptions around the Holidays in 2014 (which in hindsight was a great window of opportunity to buy).  But things have changed in the last 3 months.  Inventory has increased to 13 active listings, or 4.6 months supply – this is the largest number of homes on the market relative to the number of sales we’ve seen in 2 1/2 years.

Market Highlights

  • Closed sales are up26 homes sold in the first half of 2017, compared to 20 in the first half of 2016
  • Homes are selling faster45 Days on Market has declined from in Q2 2016 to 41 days in Q2 2017
  • Supply has more than doubled1.9 months supply in June 2016 to 4.6 in June 2017
  • Prices are flat – median prices in June 2016 were $1,497,500 compared to $1,500,000 in June 2017

When you look at the highlights, it’s easy to be confused.  Homes are selling faster yet things are slowing down?  Let me explain.  We started the year off hot out of the gates – to be specific, 11 homes have sold over the list price so far this year.  But as prices continue to bounce off record highs, buyers have become more discretionary, and have less patience for high prices.  Add to the mix a homeowner who sees his neighbor’s house sell for $2 million, and then he thinks he can get $2.2 million for his.  Only it doesn’t sell.  And in this market, when you overprice, you’ll likely get slaughtered.

“Buyers have access to more information than ever before.”

Buyers have access to more information than ever before.  Most of you reading this have probably been on Zillow or Realtor.com and have seen what’s for sale and what’s sold around your house.  Zillow will even give a “Zestimate” home price and compare it to the advertised price.  Now I’m not a big fan of Zestimates – most of the time the pricing is way off if the house hasn’t sold in the last few years, but that type of information is powerful.  Armed with information, the average buyer can spot an overpriced home.  Toss in our obsession with home improvement shows and “Million Dollar Listing,” and the buyer feels like they have more power than ever before.  Without naming specific homes, you can see exactly what I’m talking about just by looking at the current listings.  If your home is on the market for more than 90 days in this economy, you’ve definitely missed the mark.  In fact, overpriced homes sitting on the market more than 60 days are likely to sell for less than the fair market price.

I’ve pulled a few charts to give you an idea of prices and inventory, as well as a list of all the Valmonte sales so far in 2017.

Median Home Prices

Month’s Supply of Homes

First Half 2017 Valmonte Sales

Address Sales Price Original List Price Price/ foot Bed Bath Sq feet Lot Size DOM Date Sold
3700 Palos Verdes Drive N $1,070,000 $1,175,000 $587 3 2 1822 7630 4 2017-02-28
4013 Via Nivel $1,160,000 $1,158,750 $918 2 2 1263 7908 9 2017-02-09
4240 Via Alondra $1,200,000 $1,249,000 $478 4 2 2513 7295 222 2017-03-08
4028 Via Pima $1,283,000 $1,200,000 $911 3 2 1408 8886 10 2017-04-27
4400 Lucera $1,300,000 $1,349,000 $687 3 3 1893 10525 133 2017-03-03
4115 Via Nivel $1,325,000 $1,299,000 $657 3 2 2017 9112 42 2017-03-09
2716 Via Anita $1,325,000 $1,395,000 $544 4 3 2436 7116 35 2017-02-03
4041 Via Pima $1,334,041 $1,299,000 $736 3 2 1812 7110 2 2017-05-05
3001 Palos Verdes $1,400,000 $1,425,000 $715 4 3 1957 8048 109 2017-05-26
4132 Via Solano $1,449,000 $1,449,000 $838 3 3 1730 7773 54 2017-06-23
4049 Via Pavion $1,470,173 $1,399,000 $896 3 2 1640 10946 7 2017-03-24
3705 Via La Selva $1,476,000 $1,490,000 $609 4 3 2423 6358 42 2017-03-30
3828 Via Palomino $1,485,000 $1,200,000 $845 3 2 1758 10214 14 2017-05-26
3213 Paseo Del Campo $1,508,500 $1,335,000 $688 3 2 2193 14727 9 2017-02-17
2545 Via Anita $1,520,000 $1,519,000 $759 4 2 2002 7080 46 2017-02-22
3325 Palos Verdes $1,531,000 $1,549,000 $695 3 3 2203 8633 0 2017-01-18
4424 Via Pavion $1,555,000 $1,495,000 $483 5 4 3221 10008 10 2017-03-30
2724 Via Anita $1,775,000 $1,849,000 $540 6 4 3287 7133 28 2017-03-31
3005Palos Verdes $1,900,000 $1,799,000 $631 3 3 3012 8141 9 2017-05-17
3321 Via La Selva $2,050,000 $2,050,000 $756 4 3 2712 6893 4 2017-05-02
3232 Via La Selva $2,200,000 $2,195,000 $810 4 4 2716 6246 1 2017-04-21
300 Via Navajo $2,370,000 $2,500,000 $582 5 5 4071 7113 67 2017-03-28
3806 Via Palomino $2,440,000 $2,489,000 $723 4 4 3377 11898 5 2017-06-06
3617 Via Palomino $2,770,000 $2,799,000 $739 4 4 3747 10452 19 2017-04-28
3425 Via Palomino $2,775,000 $2,799,000 $890 4 3 3118 13761 7 2017-06-06
3609 Navajo Place $2,800,000 $2,895,000 $973 5 3 2878 23248 260 2017-04-12
Averages $1,710,451 $1,706,183 $719 4 3 2,431 9,394 44

So what’s the rest of 2017 going to look like? With inventory up and sales slowing across the entire South Bay and PV, the second half is likely to start off on the slow side.  If the previously mentioned 2014 holiday season is any indicator, we may have a great buying opportunity starting in late summer as inventory languishes and sellers are faced with price cuts.  Interest rates remain in the high 3% to low 4% range so patient buyers may be able to cherry pick some decent buys unless things heat up quickly.  Although in a market like Valmonte, sellers may be more discretionary that other areas, so they could end up just pulling their home off the market instead of facing a lower sales price.  And even with some of the indicators suggesting that things are leveling off, well priced homes, especially if they are newly updated or offers something unique, will still likely see plenty of interest.

In short, if you are a seller in this market, spend the time to get your house ready to sell and price it right.  If you are a buyer, get your financing together and write some offers, you’ll never get a deal standing on the sidelines.

See you in the neighborhood!

Uncategorized

Realistic Pricing? At Least for a Couple Months Anyway

July 6, 2017
PVE sign along Via Valmonte Drive

2017 started off great.  13 homes sold in the first quarter within 97% of the asking price.  But, as in the past, sellers are starting to feel confident and as a result we are seeing “optimistic” pricing.  I don’t blame sellers.  I, like many realtors, am an optimist (you sort of have to be in order to survive in this career).  We tell our clients “prices are rising,” or  “there’s no inventory!” and the “buyers are hungry.”  In fact, I took most of these statements from blog posts and articles I’ve written over the past 12 months.  Some of it is definitely true.  Prices are at record highs in Valmonte and elsewhere – see the chart below.

Buy buyers aren’t dumb, nor irrational.  You can make the argument that as prices climb, buyers become more discretionary.  When you look at homes over the 6 or 12 month median, buyers have more choices and more things to consider.  Take a look at the inventory/supply chart below.  It’s based on month’s supply of inventory and compared to last year, inventory is definitely rising.  Turnover in Valmonte is the lowest of all the neighborhoods in PV, and the normal scarcity of homes helps push the prices up.  Why the recent increase in inventory? The increase is more likely due to a seasonal increase and won’t likely be sustained.  Several of the homes on the market are the result of divorce, job relocations, and retirements, as opposed to people moving out of the area because they don’t like it.

There’s some good news in the tea leaves.  Price strength is supported from the bottom up.  So far to date, the lowest priced home sold was $1,070,000  (3700 PV Dr North). There have been more homes sold over $2m than ever before.  But the question everyone is asking, “can it keep going up?”  In the chart below, the median sales price (weighted over 12 months) has plateaued in Valmonte while it has continued to rise in all of Palos Verdes Estates.  Going beyond the numbers alone, the increase in PVE v Valmonte could be due to the larger homes and new construction in the areas of the city outside of Valmonte like Montemalaga and Lunada Bay.  Those areas boast average lot sizes of 14,000′ allowing much larger homes to be built.  In fact, in 2017, the average home sale in Montemalaga is $2.7m.  However, on a price/foot basis, Valmonte actually exceeds the median price/foot for the entire city.

Median Price/Foot (12 month rolling average – click to select a specific month)

The litmus test: The fundamentals remain – buyers still want to move to nice neighborhoods like Valmonte, and sellers are reluctant to sell until they have to.  This creates a supply and demand imbalance that continues to favor the seller, and it doesn’t seem to be changing too quickly.

For more about the real estate market, I encourage you to listen to the Chief Economist at the California Association of Realtors in her recent Q&A at the Teles Properties Headquarters in Beverly Hills.  She had some great insights to the current market, what the future looks like, and how the market has changed in the recent cycle.

Real Estate Market, Valmonte Homes

Palos Verdes Estates: Valmonte Home Prices Set a New Record in 2016!

December 14, 2016
Quiet December night in Malaga Cove

As we near the end of the calendar year, we can clearly see that home prices have rebounded from market lows and have exceeded previous records set during the last peak.  For Palos Verdes Estates, Malaga Cove posted the highest year over year appreciation for the 4 areas (Valmonte, Malaga Cove, Monte Malaga, and Lunada Bay) with Valmonte not too far behind.  Here’s how they stack up on a price per square foot basis for the last 12 months:

  • Malaga Cove – $921/sq foot (up 21.2%)
  • Valmonte – $741/sq foot (up 12.8%)
  • Lunada Bay – $670/sq foot (up 2.6%)
  • Monte Malaga – $654/sq foot (down 17.4%)

What do the numbers mean? – Each area has its unique features that make it more or less popular given the market demand.  Valmonte and Lunada Bay are both seeing a huge increase in new families with young children moving in.  Because the lots are typically smaller in Valmonte compared to Lunada Bay, the homes are a little smaller and people are willing to pay more per foot to be on one of the flat tree-lined streets that make Valmonte attractive.  Malaga Cove on the other hand boasts panoramic ocean views from nearly every home and buyers are willing to pay a premium for views.  Finally, Monte Malaga offers some of the largest homes on the hill so the price per foot tends to drop while the average priced home is typically more than Valmonte or Lunada Bay.  I’ve shared a graph below showing the average sales price in each area and you can see how area differs with regard to average sales price.


Keep in mind these are all averages.  Supply fluctuations as well the unique qualities of each home that is sold affects these numbers.  If all the homes sold in a particular year were brand new with ocean views, I’m sure the numbers would look a lot different.  This is rarely the case, so each home needs to be analyzed independently.  In all, it’s been a good year for property owners in Palos Verdes Estates.  Home prices are continuing to trend upward, supply is still in check, and buyers are returning to the market after the election.  The challenges we face in the short term are rising interest rates and lack of supply especially with entry level homes.

If you would like a custom estimate of value for your home, please visit pvehomeprices.com and we’ll send a report out to you right away.  If you would like advice about buying or selling a home in 2017, please feel free to contact Kyle directly at 310-483-3998.  Happy Holidays!

Real Estate Market, Valmonte Homes

SOLD: Second all-time highest sales price in Valmonte

February 11, 2016
2921 via la selva pool

The pool at 2921 Via la Selva

I’m not sure if it’s just the weather, but things have been heating up in the Valmonte real estate market, and elsewhere for that matter.  In the last week, we have seen several good signs that will hopefully continue into the spring.  First, 2921 Via la Selva sold for $3,050,000 ($909/foot down from from $3,295,000 on February 9th).  This was the second highest sales price in Valmonte, ever.  The home is a Santa Barbara style Spanish ranch home on one level on nearly a half-acre.  The home was built in 2007 and features 4 bedrooms, 6 baths with entertaining space that opens to a stone patio and outdoor dining area, guest house, pool (you actually walk on stepping stones across the pool to get to the guest house and rest of the yard), and a rare 3 car garage.  All of this backs up to the Valmonte trail and is on one of the best streets in all of Palos Verdes Estates.  Pretty much a one of a kind Valmonte dream house.

IMG_5699

2544 Via Anita – 4 bedrooms/3 baths – $1,795,000

As for the rest of the recent activity, across the street from the dream house, 2928 Via la Selva, priced at $2,899,000 ($610/foot) is in escrow, and further east near the school, 3728 Via la Selva closed at $1,403,000 ($737/foot) on February 1.  If you are a buyer, inventory is still lean with only 6 homes on the market (3108 Via la Selva fell out of escrow and is back on), and 2544 Via Anita is the only new home to see.  As for 2544 Via Anita, it’s a nicely finished two story home with the living space and two bedrooms upstairs, with two more bedrooms and a family room downstairs that opens to a deck and nice yard.  It’s priced slightly below last year’s average price/foot at $1.795m ($650/foot) which is fair considering the recent updates and spacious living spaces.

I anticipate an improvement in inventory as we move closer to Spring, but for now, it’s slim pickin’s for the buyers out there and prime time to be a seller in Valmonte.

image1

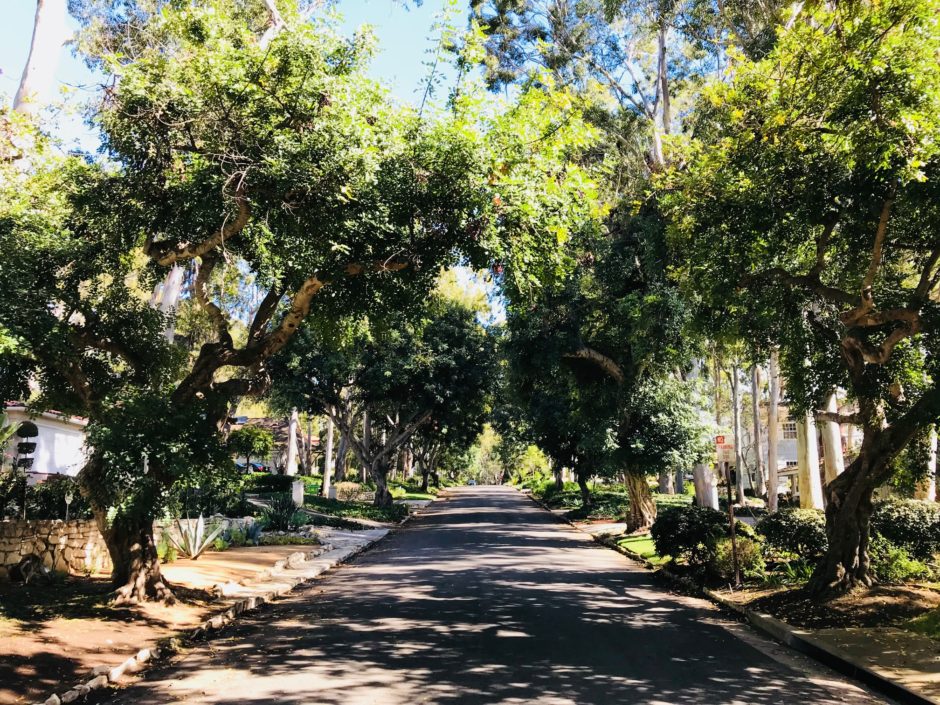
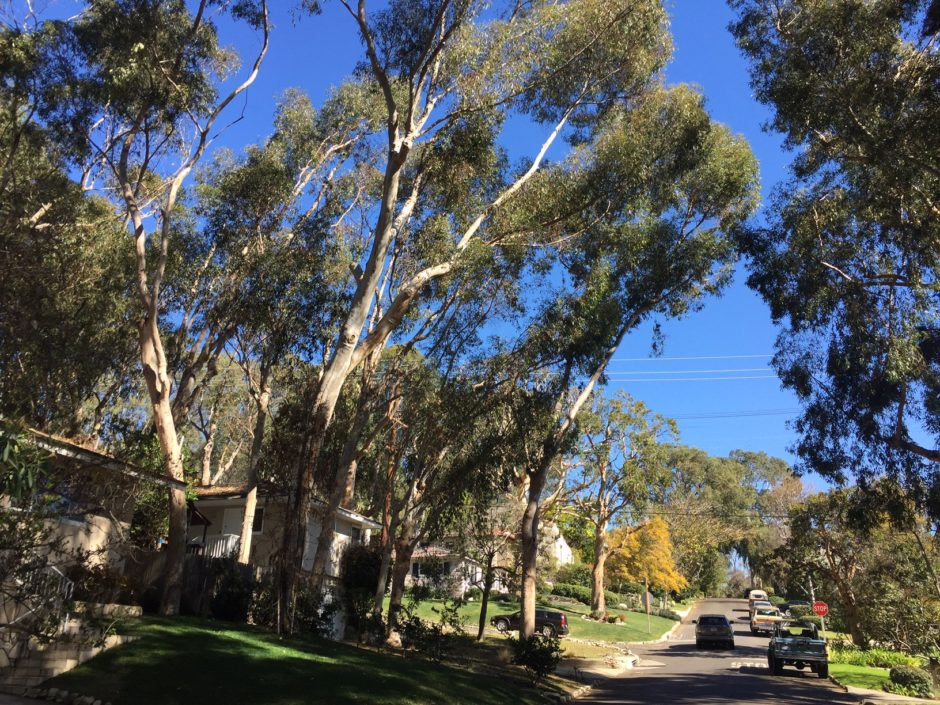
The tree lined streets of the grove in Valmonte – a nice place to be when the sun is shining and the wind isn’t blowing!

Real Estate Market, Valmonte Homes

Say what? This one sold grossly under market!

February 4, 2016
IMG_5606

4033 Via Valmonte sold for $1.12m in January

You’ve heard me say it before, 2015 was a great year in real estate in Valmonte.  Prices were up and the number of sales was the best in nearly 20 years.  So with all this great news, how did a move-in ready home with views sell for $1850/foot under the average price?  The story gets even more interesting when I add the fact that when I contacted the agent on behalf of my client, he informed me there were multiple offers within the first two weeks of being on the market.  Yes it was over the holidays, but how do you sell for $1.12m a 2,367 square foot 4 bedroom, 3 bath  home with mountain views and a nicely landscaped backyard, when a similar sized, albeit more updated, home sold less than 3 weeks prior for $1.625m?  This just smells fishy.  I know I sound like I’m whining, but I have a point.  The agent was not a local agent, and the sales price reflects this.  I hate to see good people get ripped off.  This house should have sold over asking and a lot closer to $1.4 million.  So if you are thinking of selling, please, I beg you, interview a local expert before you fall victim to an agent that doesn’t have his/her client’s best interests in mind.  Okay, I’m off my soapbox.

IMG_5600

View from the second floor balcony looking towards the Hollywood Hills

Household Tips, Neighborhood News

Neighborhood Watch Meeting

January 27, 2016

PVE Neighborhood Watch

Friends and neighbors,

With all the recent burglaries and break-ins over the last 6 months, it’s time to take action.  PVE Neighborhood Watch will be hosting a meeting on Thursday, February 4th, from 6:30-7:30 pm in the Valmonte Elementary School multi-purpose room.

I hope to see you all there.

Here’s the information from the invitation:

Please join us for a Neighborhood Watch Meeting with Guest Speaker PVE Chief of Police, Jeff Kepley.

Learn about:

  • Increase of Burglaries in our Community
  • Crime Prevention
  • Community & Law Enforcement Coordination to Stop Crime

For more information:  Contact Karen Logan PVE Neighborhood Watch Coordinator for Valmonte:  kklogan1@mac.com

PS:  Help us update our address list!  If you are no longer in Valmonte or we have an outdated email, let us know.  Thank you!!

Uncategorized

Valmonte Home Sales Keep Pace in October

November 2, 2015

Chugging Right Along     October 2015 sales of single family homes in Valmonte kept pace with September and is contributing to 2015 going down as one of the best years in recent memory.  In all 4 homes sold in October priced from $1.137m to 1.65m all in the eastern part of Valmonte “where the sun always shines.”  Three of the houses were listed on the MLS and took anywhere from 7 to 126 days to sell; the fourth, on Via Valmonte sold off-market for $1.55m.  The selling to asking price averaged 94% as all marketed homes required price reductions to sell.   As for active listings, there are 10 homes listed for sale in Valmonte, priced from $1.338m for a smaller home on PV Drive North to an updated one story on Via Palomino priced at $2.295m. For the year, the average sales price through October 31st is a record $1.539m – up about 14% from 2014.  On top of that, there have already been 49 sales through September 30th this year, compared to 34 homes sold in all of 2014.  Historically speaking, on a price/foot basic, prices have rallied 28% from market lows set in 2012 ($509/foot); however, the average price/foot is off 11% from market highs set in 2005 ($729/foot) and 2006 ($728/foot).

What is the take-away from all of this?     As the traditional summer selling season comes to an end, there are still plenty of opportunities to buy and sell a home in Valmonte.  The lending market is still favorable to well qualified buyers with rates hovering in the 4% range.  For those looking to buy, this may be your best chance.  Home prices are expected to continue to rise moderately in 2016 and interest rates are likely to see a moderate increase as well.  Inventory remains below the “balanced” level of 5 months supply with a current 2.3 months supply, indicating this is still a seller’s market.  However, as homes continue to sit empty or with sellers eager to move, this may be the chance to negotiate a good price for your next home.

See you in the neighborhood . . . .

208 Alcance

SOLD: 208 Via Alcance – $1.137 gets you this 1800′ fixer

300 Alcance

FOR SALE: 300 Alcance – $1.699 remodeled and across from the school